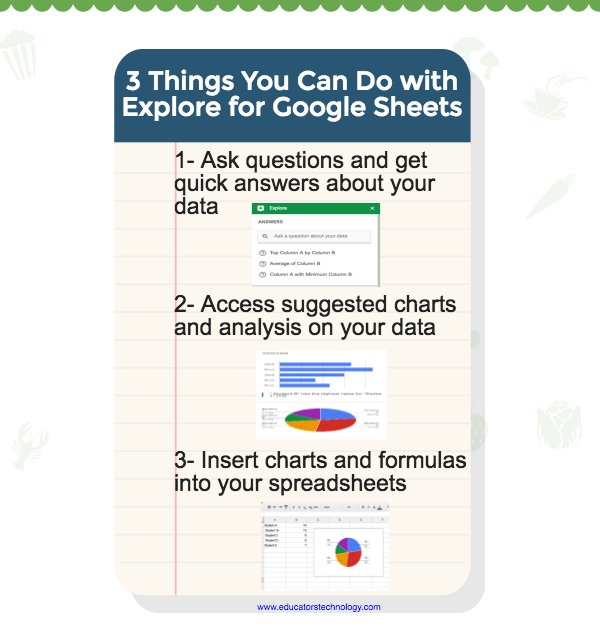
Explore in Sheets provides you with 3 main features: The ability to ask questions and get answers related to your data, see generated charts and analytic reports on your data, add generated charts to your spreadsheets.
1- Answers to questions
This is only available in English. When you type in data in your sheets, you can use Explore to access quick answers to questions about your data. For instance, in the spreadsheet you created are two columns one for the name of the students and the other for their scores. Examples of the questions you can ask Explore to answer include: what is the total of column B? Which student has the top/least score?. You can also click on suggested questions from Explore to see examples of answers.

Here is how to use this feature:
- ‘Open a spreadsheet in Google Sheets.
- In the bottom right, click Explore Explore.
- Under "Answers," type your question in the box and press Enter.
- To see example answers, click the suggested questions under the text box.’
2- Charts and analysis
Based on the data you typed in your spreadsheet, Explore provides you with charts and analysis showing trends and patterns in your data. You can also get insights for specific portion of your data by selecting only specific cells. When you hover over any part of the chart you will see the corresponding data on which it was based.

3- Insert charts into your spreadsheets
You can also easily add generated charts and formulae from Explore window right into your spreadsheet. You simply drag and drop the chart or formula wherever you want in your spreadsheet. To edit a chart, hover your mouse over the chart and click on edit button.

Source: Docs Editor Help
Tidak ada komentar:
Posting Komentar